SteelEngine provides comprehensive logging for all workflow executions, giving you complete visibility into how your workflows run, what data flows through them, and where issues might occur.
Logging System
SteelEngine offers two complementary logging interfaces to match different workflows and use cases:
Real-Time Console
During manual or chat workflow execution, logs appear in real-time in the Console panel on the right side of the workflow editor:
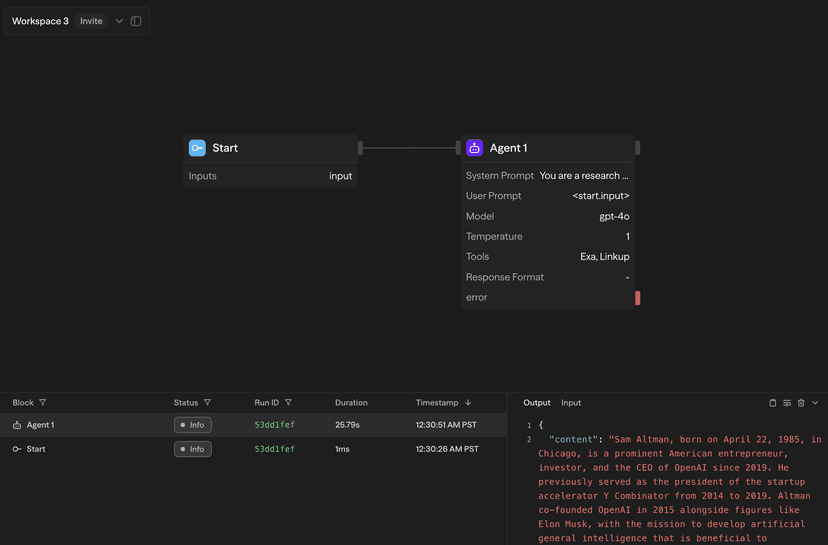
The console shows:
- Block execution progress with active block highlighting
- Real-time outputs as blocks complete
- Execution timing for each block
- Success/error status indicators
Logs Page
All workflow executions—whether triggered manually or by API, Hosted Chat, Schedule, Webhook, MCP, A2A, another workflow, or an integration trigger—are logged to the dedicated Logs page:
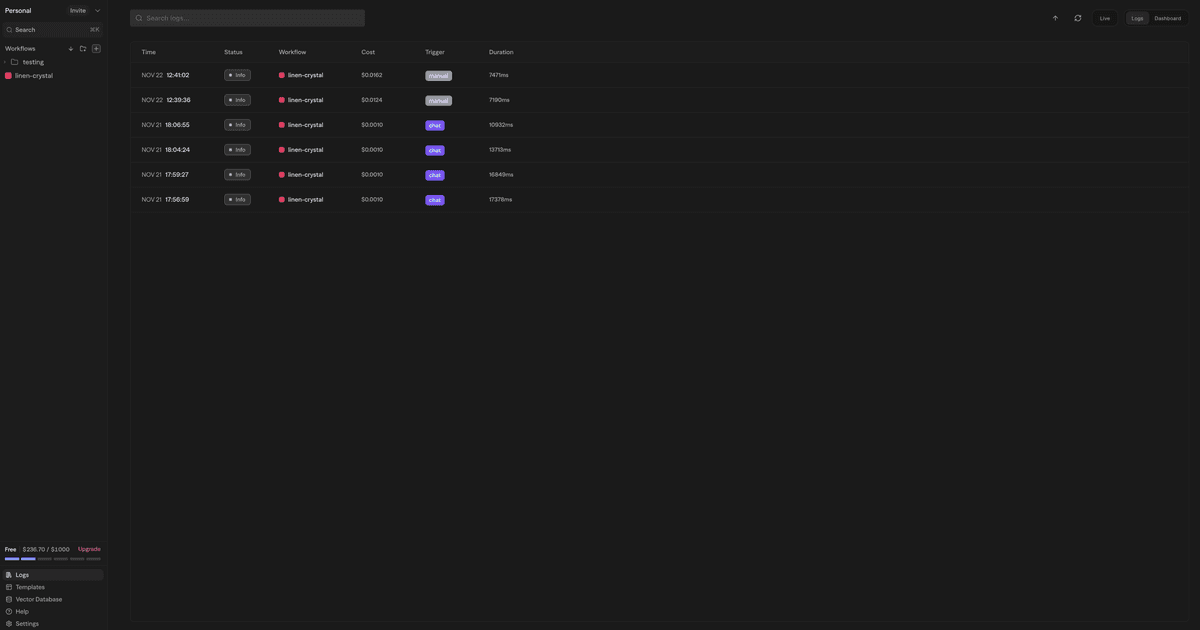
The Logs page provides:
- Comprehensive filtering by time range, status, trigger type, folder, and workflow
- Search functionality across all logs
- Live mode for real-time updates
- 30 days of run history on SteelEngine Cloud, longer by Enterprise agreement (see Log Retention)
The trigger filter lists Manual, API, Schedule, Hosted Chat, Hosted Form, Webhook, MCP, A2A, Chat, Sub agent, and Workflow, plus one entry for each integration that has a trigger.
Log Details Sidebar
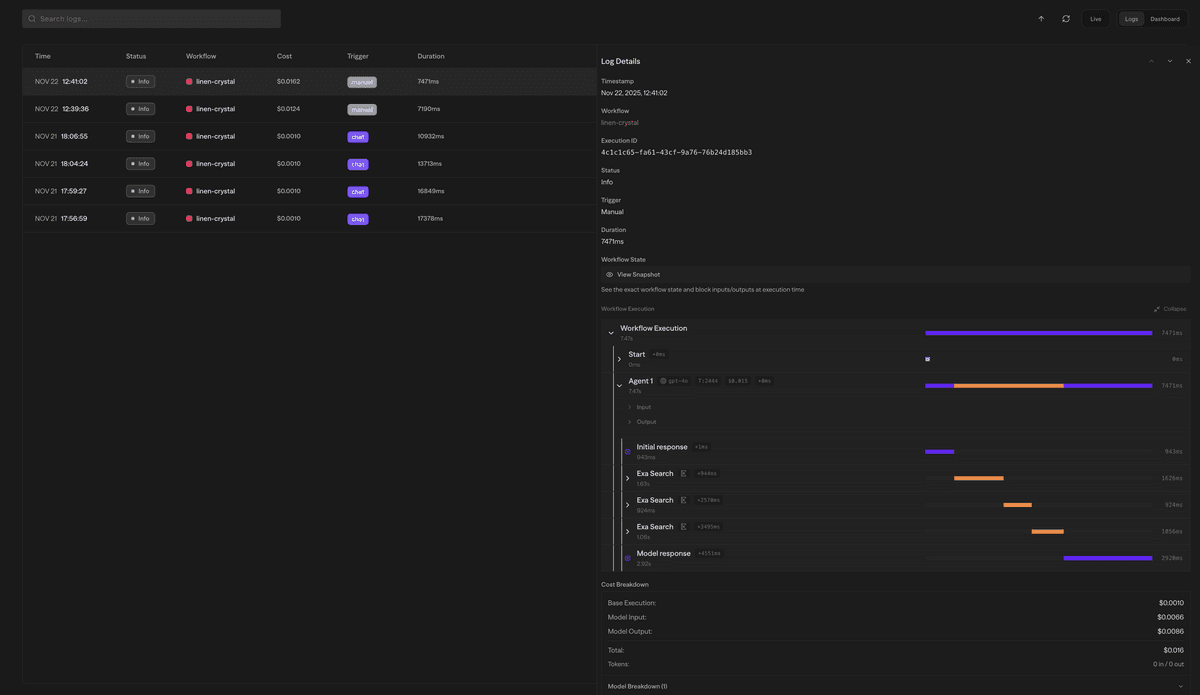
Clicking on any log entry opens a detailed sidebar view:
Block Input/Output
View the complete data flow for each block with tabs to switch between:
Output Tab shows the block's execution result:
- Structured data with JSON formatting
- Markdown rendering for AI-generated content
- Copy button for easy data extraction
Execution Timeline
For workflow-level logs, view detailed execution metrics:
- Start and end timestamps
- Total workflow duration
- Individual block execution times
- Performance bottleneck identification
Chat Context and Scheduled Sub Agents
Opening Chat from a log attaches the selected execution ID. Chat resolves that execution's authorized details, so the conversation stays tied to the run you selected even when workflows have similar names.
For a scheduled prompt task, open Automations, select the Subagent, and inspect its run history. One occurrence has one execution ID, even when the assistant makes multiple model and tool calls. Its details include the final assistant output and available tool diagnostics, timing, model usage, and errors. Diagnostic inputs and outputs are bounded and redacted.
The log appears as Running when execution starts and updates to its final status when execution ends. Refreshing the page preserves the running state. Trace spans without a registered icon show a wrench.
Automations also provides detail pages for scheduled workflows, polling triggers, and webhooks. Available run costs use the same credit conversion as Logs. Timestamps follow your browser's local timezone, and execution details respect your Logs permissions.
New Subagent logs save model input, output, and total costs from reported token usage and the model pricing catalog, including cached input rates. The cost breakdown shows token counts and excludes the workflow base execution charge. Usage reported by completed model steps is retained if the run fails or is cancelled. Older logs without saved cost do not show a breakdown.
Every successful scheduled run writes a concise job-history summary with update_job_history for later occurrences to read. That summary is distinct from the final run output. A finished until-complete task must also successfully call complete_job; a missing or failed required lifecycle write is reported as a failed run. If the assistant starts a workflow, the child workflow has its own entry on the Logs page. See Tasks & Jobs.
Workflow Snapshots
For any logged execution, click "View Snapshot" to see the exact workflow state at execution time:
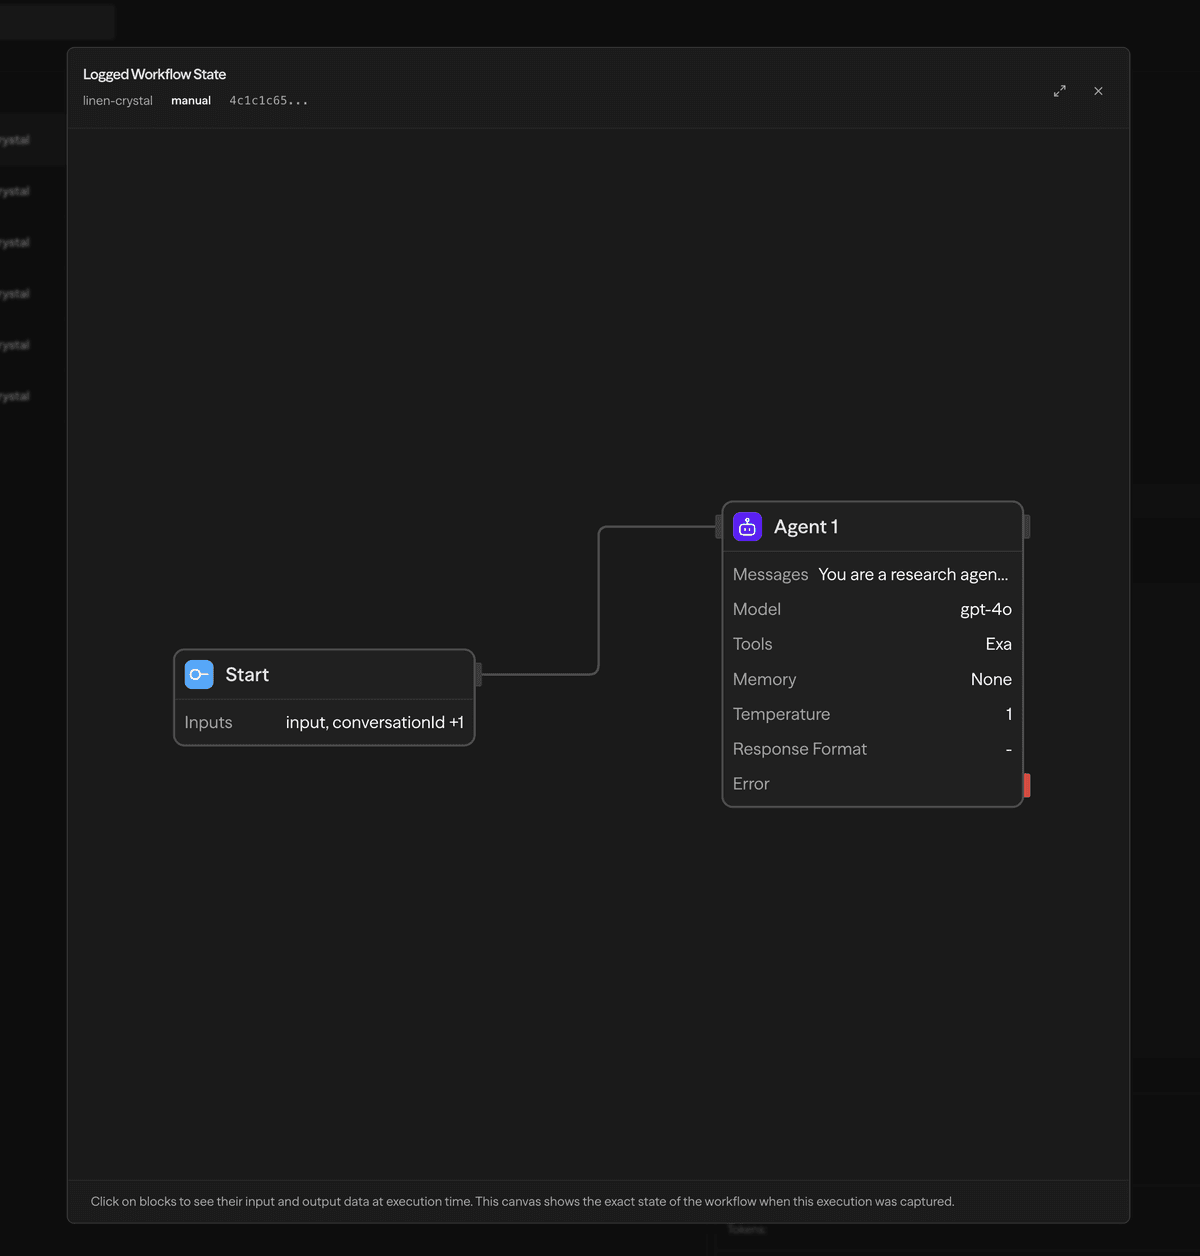
The snapshot provides:
- Frozen canvas showing the workflow structure
- Block states and connections as they were during execution
- Click any block to see its inputs and outputs
- Useful for debugging workflows that have since been modified
Workflow snapshots are only available for executions after the enhanced logging system was introduced. Older migrated logs show a "Logged State Not Found" message.
Log Retention
On SteelEngine Cloud, run history is kept for 30 days after a run finishes. That covers the execution log, its trace spans, block inputs and outputs, files produced by the run, and the workflow snapshot. After 30 days the run is deleted: it leaves the Logs page and the logs API, and the files it produced are deleted with it. A copy of the deleted run stays in internal storage for about another week and is then deleted too.
- Workflow graph snapshots, including child-workflow snapshots, currently remain stored after their logs expire. Snapshot cleanup is suspended to keep child-workflow views available for retained runs.
- Files a run only used, such as workspace documents it read, are not run history. Deleting a run never deletes them.
- A run that is paused or waiting for an approval is never removed while it waits. Its 30 days start when it finishes.
- Enterprise agreements can keep run history longer, for example 90 days or a year. Your account team sets the period for your organization, and it applies to every workspace in it.
- The detailed execution record behind a run is kept for 7 days after it finishes. After that, Get Job Status answers from run history, and promotion validation needs runs from the last 7 days.
Self-hosted deployments choose their own retention; see Run History Retention.
Best Practices
For Development
- Use the real-time console for immediate feedback during testing
- Check block inputs and outputs to verify data flow
- Use workflow snapshots to compare working vs. broken versions
For Production
- Monitor the Logs page regularly for errors or performance issues
- Set up filters to focus on specific workflows or time periods
- Use live mode during critical deployments to watch executions in real-time
For Debugging
- Always check the execution timeline to identify slow blocks
- Compare inputs between working and failing executions
- Use workflow snapshots to see the exact state when issues occurred
Next Steps
- Learn about Cost Calculation to understand workflow pricing
- Explore the External API for programmatic log access
- Set up Notifications for real-time alerts via webhook, email, or Slack